Declining Dust In Northern Hemisphere Matches Ocean Foodchain Collapse
NASA Report Shows 20 Years Of Tragic Decline In Northern Hemisphere Dust Seen By State The Art Satellites
Rate of dust loss at 1.5% – 4.3% per year correlates with the dramatic collapse of ocean phytoplankton that depends on dust for its vital minerals
Less dust blowing means the ocean have stopped growing
In a new report just released by NASA a 20 year dust decline is reported using the best of satellite instruments. This 20-year time frame which shows a steady 1.5% (in some places a 4.3%) annual decline clearly infers that the dust has been disappearing for decades longer. But the ‘hard data’ from the latest generation of earth-observing satellites only covers this relatively brief recent time frame. Global agronomists and oceanographers have been reporting on the decline of dust for the past 40+ years. That would suggest a dust loss amounting nearing 60%.
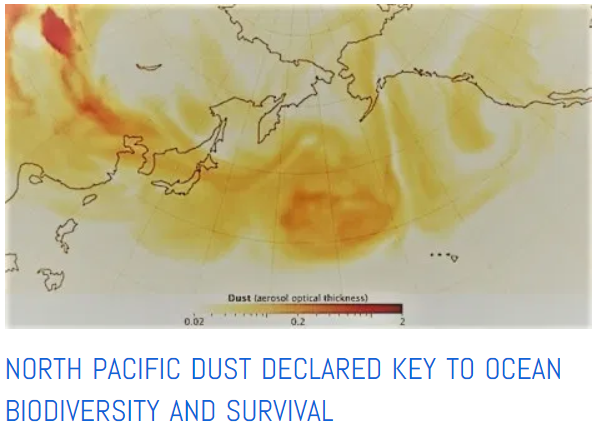
A PNAS paper from 2019 is one of many reporting on the vital role of Asian dust for health , abundance, and biodiversity of North Pacific ocean plankton pastures. Click to read more
Dust that blows from the land mostly lands in the seas, there it is a vital source of mineral micronutrients for the phytoplankton that grow in ocean pastures. Think of ‘dustfall’ being the counterpart of ‘rainfall’ that is vital to keep pastures on land healthy, when rain stops falling it results in catastrophic droughts and resulting declines in livestock carrying capacity of those pastures.
In the ocean, the same pasture ecology operates save for the fact that ocean pastures require dustfall instead of rainfall to thrive and sustain the ‘livestock’, the fish. With today’s decades-long worsening demise of dust for the oceans, the widely reported collapse of plankton and fisheries is easily attributed to the drought of dust.
Among the most useful and longest-lived dust-monitoring sensors in space today is the Moderate Resolution Imaging Spectroradiometer (MODIS) on NASA’s Terra and Aqua satellites. Terra MODIS has collected more than 20 years of dust data; Aqua MODIS has observed for 18 years.
“Two decades is long enough to look for meaningful trends in atmospheric dust,” said NASA atmospheric scientist Hongbin Yu.
In the just-released study in Atmospheric Chemistry and Physics, Yu and colleagues detailed their efforts to do just that.
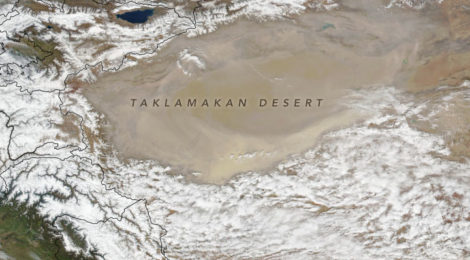
“We looked at the world’s six major dust outflow regions. We found decreases in dust in the area we defined as the northwestern Pacific. In other words, the dust that blows east from deserts in western China and Mongolia, such as the Taklamakan and Gobi deserts.”
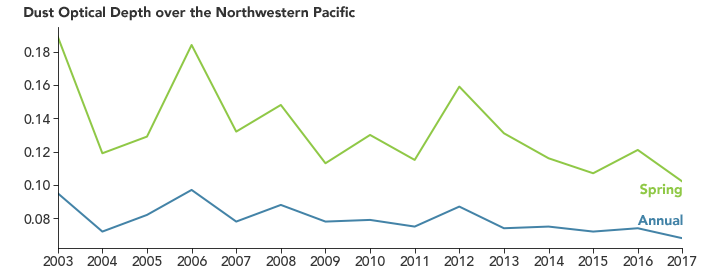
Dust decline in the N. Pacific measured by the most modern instrument data. Reports from earlier decades are consistent with the observed trend of a loss rate of 4.3% during the most important springtime when ocean pastures are getting ready to bloom.
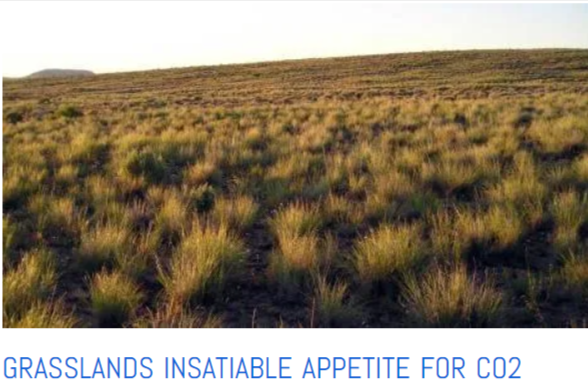
Grasslands, especially the dryland bunch grasses are growing faster as carbon dioxide levels rise, according to data from a long-term ecological field experiment in Minnesota. The research findings, published on 19 April 2019 in Science, run counter to some long-established ideas about how plants will respond to the greenhouse gas. Click to read more
It is widely reported in the scientific literature that the drylands of Western China and Mongolia including the Gobi and Taklamakan deserts are the most vital source of mineral micronutrient dust to the oceans of the Northern Hemisphere. Drylands are grasslands, they are green and lush during the wet times of the year but turn brown and dusty in the dry times. In today’s world of almost 50% higher CO2 levels in the air that high and rising CO2 allows dryland grasses to lose 10%-20% less water by evapotranspiration as the dry seasons set in. That water saving is like early dry season rains that extend the growing season. The grasses remain green and lush for many weeks longer each year and cover the ground. When there is more grass growing there is less dust blowing.
In the Asian region of the vast grasslands of Gobi and Taklamakan, dust activity has declined since the early 2000s. Over the course of the MODIS record, the researchers found a 1.5 percent decrease in the atmospheric dust detected by the sensor each year.
“More detailed analysis showed that the trend was due to changes in the spring—March, April, and May,” said Yu.
Scientists using other sensors and analysis techniques have noted the same pattern. Ground-based LIDARS in Japan detected a much larger 4.3 percent decrease in spring dust. A team of Chinese scientists analyzed data from ground-based weather stations and an atmospheric model and concluded that spring dust storm frequency in arid and semiarid regions of China had decreased by 15 storms per year on average over a period of 25 years. That cuts the expected dust events by about half.
Tragically the loss of spring and early summer dust is all the worse for ocean pastures in the Northern Hemisphere. The spring and summer is their blooming time and with this sudden anthropogenic loss of vital dust taking place at precisely the worst time for ocean pasture blooms, the deleterious effect by the loss of primary ocean productivity is greatly compounded. Mother Nature doesn’t work on a convenient annual climate model basis she has her special times. For every thing, there is a season.
Several research teams have addressed the obvious question: why?
“There are three main factors that people have looked at: changes in winds, changes in vegetation cover, and changes in soil moisture,” said Yu. Changes in wind speeds, as well as wind shear, can affect how much dust winds can pick up. The presence of vegetation reduces how much dust winds can lift. And winds more easily lift dust from drier surfaces than wetter ones.
Several studies also show increases in green vegetation and forests, likely due to global warming, reforestation projects, and efforts to prevent overgrazing.
NASA Earth Observatory images by Joshua Stevens, using VIIRS data from NASA EOSDIS/LANCE and GIBS/Worldview and the Suomi National Polar-orbiting Partnership, and data courtesy of Hongbin, Y., et al. (2020). Story by Adam Voiland.
References & Resources
An, L. et al. (2018) Temporal and spatial variations in sand and dust storm events in East Asia from 2007 to 2016: Relationships with surface conditions and climate change. Science of the Total Environment, (633) 15, 452-462.
Fan, B. et al. (2014) Earlier vegetation green-up has reduced spring dust storms. Scientific Reports, 4, 6749.
Guo, J. et al. (2019) The Trend Reversal of Dust Aerosol Over East Asia and the North Pacific Ocean Attributed to Large? Scale Meteorology, Deposition, and Soil Moisture. JGR Atmospheres, 4, 6749.
Shimizu, A. et al. (2017) Variations of Dust Extinction Coefficient Estimated by Lidar Observations over Japan, 2007-2016. SOLA, 13, 205-208.
Song, H. et al. (2016) Spatial and temporal variations of spring dust emissions in northern China over the last 30 years. Atmospheric Environment, 126, 117-127.
Yu, H. et al. (2020) Interannual variability and trends of combustion aerosol and dust in major continental outflows revealed by MODIS retrievals and CAM5 simulations during 2003-2017. Atmospheric Chemistry Physics, 20, 139-161.


